The Fastest Way to Get from LiDAR to a Drainage Design
Draw a field boundary. Pull high-resolution LiDAR automatically — faster than any other tool in the industry. Get a graded, sized tile layout with stepped mains and export-ready files in minutes. No desktop GIS, no manual data processing.
Just want to explore?
Professional Drainage Design Powered by LiDAR
Geo-Surface is the design platform drainage contractors and ag professionals actually use. Pull high-resolution LiDAR across the US and Canada, run flow and terrain analysis, then design a complete tile or surface drainage system with grading, pipe sizing, and machine-ready exports — all in your browser. No desktop GIS. No waiting on engineers. Just faster quotes and better designs.
Geo-Surface Drain Pro
The complete LiDAR-to-design platform for tile and surface drainage. Automatic elevation data, best-fit grade optimization, stepped main sizing, and machine-ready exports — all in your browser.
- Pull LiDAR automatically with broad coverage across the US and growing coverage in Canada, or import your own survey DEMs.
- See where water goes — flow paths, depressions, ponding risk, and wetness layers generated in seconds.
- Design mains, submains, and laterals with connection snapping, automated validation, and stepped pipe sizing.
- Best-fit grade optimization ensures accurate slopes and minimizes cut/fill across every run.
- Pattern-tile layouts with automatic spacing, sizing, and materials estimation for fast quoting.
- Export to Shapefile, KML, or DXF for machine guidance, AGPS DirtPro/PipeFM, Google Earth, and GIS — plus professional PDF reports.
Lock in intro pricing forever — rates will increase for new subscribers
LiDAR Extractor
Survey-grade LiDAR data in the format your other software needs. Pull elevation data for any field in seconds. Free for all Drain Pro members.
- 7 export formats: GeoTIFF, Shapefile, CSV, KML, ASCII Grid, Surfer GRD, and AGS (OptiSurface) — ready for QGIS, ArcGIS, Google Earth, OptiSurface, and more
- Flexible resolution (1m–500m): Precision drainage-grade detail or efficient regional-scale data, with intelligent resampling
- Full US & Canadian coverage: One interface for USGS 3DEP and NRCan HRDEM — no hunting through government portals
- 3D preview before download: Verify coverage and quality before exporting
- Automatic coordinate handling: UTM, Web Mercator, or WGS84 in meters or feet — no manual CRS headaches
Geo-Surface Viewer
Explore LiDAR terrain data for any field at no cost. Review designs created in Drain Pro or share project files with landowners — no sign-up required.
- View LiDAR terrain maps and elevation colorization for any field within coverage.
- Explore slopes, ridges, and flow paths in 2D and 3D with high-resolution terrain data.
- Open and review drainage designs created in Geo-Surface Drain Pro — great for sharing with clients.
- Runs in your browser — nothing to install, nothing to configure.
Start Your Drain Pro Subscription
Select your region and complete signup in under 2 minutes. Get instant access to professional LiDAR-based drainage design.
Sign Up — United States
Geo-Surface Drain Pro
High-Resolution LiDAR to Build-Ready Drainage Designs
Geo-Surface Drain Pro handles the entire workflow: automatic LiDAR fetch, terrain analysis, grade optimization, pipe sizing, and professional exports. What used to take hours of manual data processing happens in minutes.
to see Drain Pro in action
See What's New in v2.3Setup & Analysis
Start every project with clean, trusted elevation. Drain Pro automatically pulls LiDAR where available, builds high-resolution terrain layers, and shows you exactly how water wants to move—before you draw a single line.

Complete Design Workspace
Three focused tabs—Setup, Design, Export—guide you from boundary to final plan in a single, consistent interface.

Automatic LiDAR Import
Instantly fetch LiDAR-based elevation for supported regions in Canada and the US, or drop in your own DEMs when you've got them.
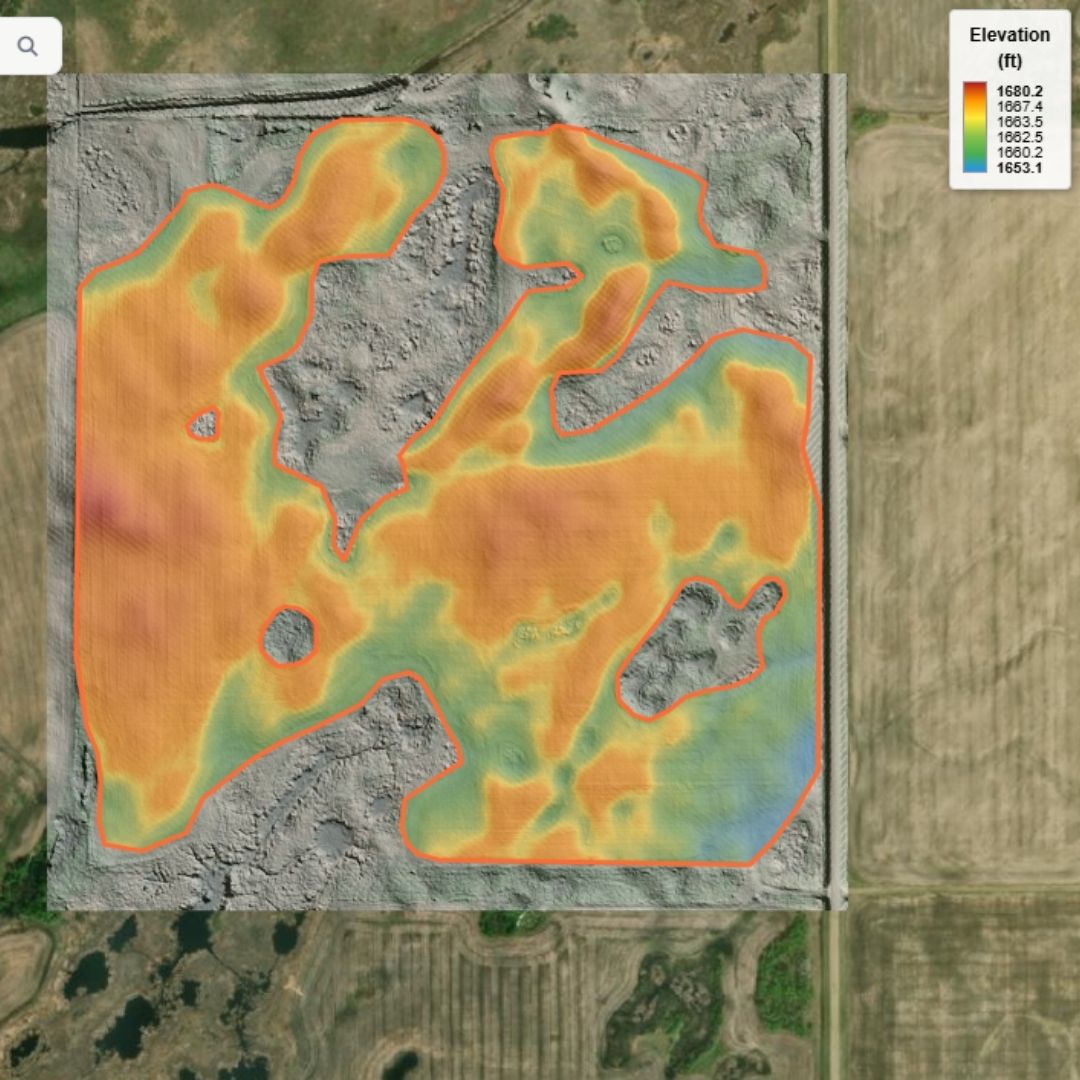
High-Resolution Terrain Display
Elevation colorization dialled for drainage work, so subtle slopes and problem spots stand out immediately.

Flow Path Mapping
Generate precise flow routes to see how water actually drains and where mains and surface ditches should go.

Wetness Potential Layers
Topographic wetness and ponding tools flag the chronically wet acres that are stealing yield.

Depression & Ponding Detection
Automatically identify low pockets and isolation spots to prioritize cuts, tile, or outlets.
Intelligent Design Tools
Draw once, trust it. Drain Pro enforces connections, grades, and hierarchy so your designs behave like a real system, not a scribble on an aerial.
Interactive Design Tools
Draw mains, submains, and laterals directly on the map with live LiDAR-based profiles and instant feedback. Hover any line for quick stats, click to select.

Automatic Network Hierarchy
Clean IDs and structure (mains, submains, laterals) handled for you — no more manual naming chaos.

Connection Validation
Snapping, depth checks, and warnings ensure everything ties together and drains the right way.

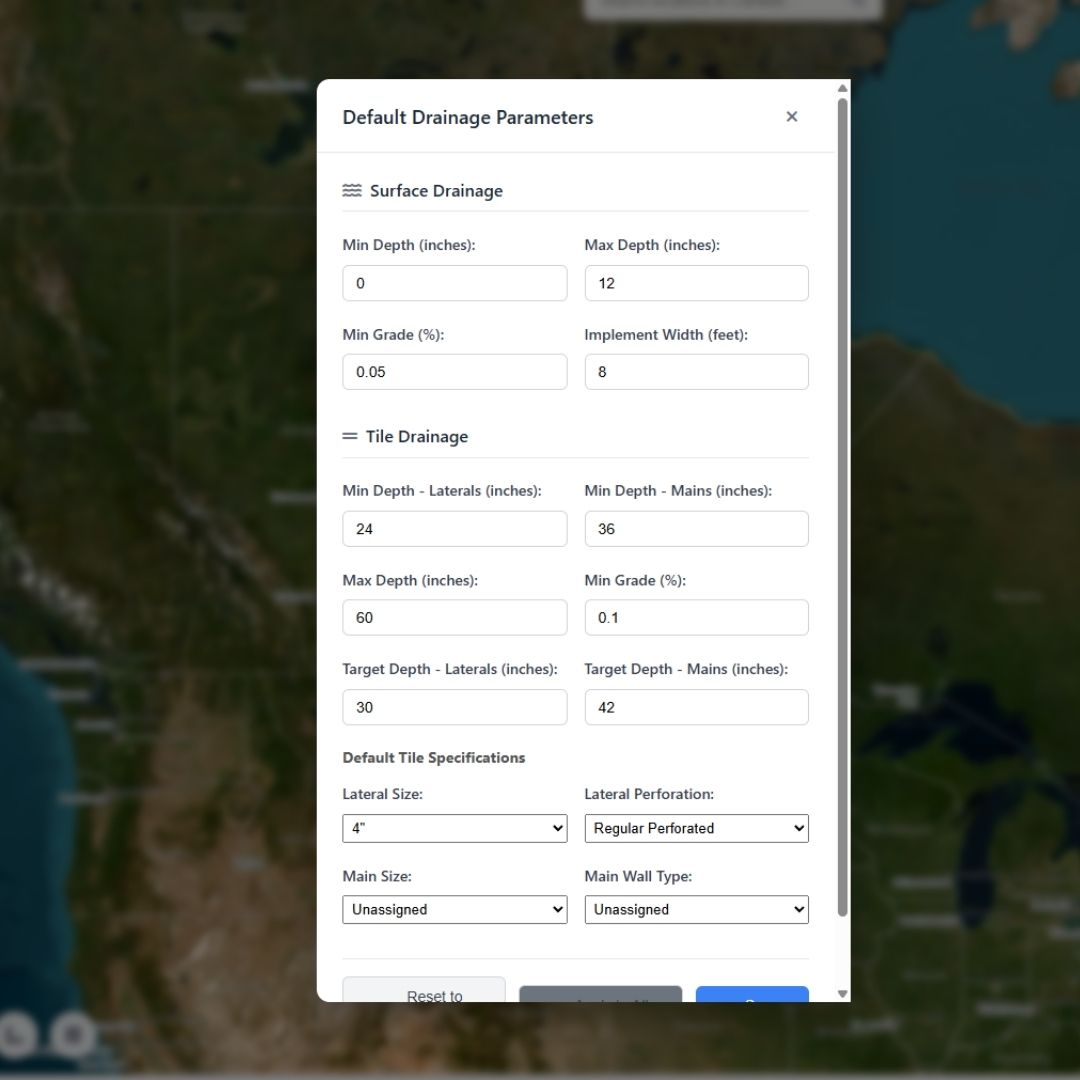
Best-Fit Grade Optimization
Best-fit, constant-grade, and freeform grade tools lock in slopes, starting depths, and outlet conditions that work in the real world. Earthwork estimates and depth violation warnings built in.

Stepped Main Sizing
Automatic step-down pipe sizes at every lateral connection, based on cumulative contributing area. Each segment color-coded on the map so you can verify the design at a glance.

Pattern Tile Layout
Generate systematic laterals with customizable spacing and automatic connection to mains. Adjust spacing grids with angle-pick from existing lines.
CAD-Style Annotations
Dimension lines, text labels, arrows, rectangles, filled areas, and exclusion zones — all on a toggleable layer included in project backups.
Surface Inlets
Place surface inlets on mains with flow-rate sizing. Inlet flow is automatically factored into downstream pipe calculations.
Pipe Size Color Mode
View your entire design color-coded by pipe size with customizable colors. Dual-wall pipes display a distinctive block pattern.
Grid Overlay
Customizable spacing grid you can snap to the bearing of any existing line — helps with precise manual lateral placement.
Export & Reporting
When the design is done, Drain Pro gives you machine-ready files and professional client deliverables — no extra software needed.

Professional PDF Reports
One-click reports with map overviews, pipe schedules, stepped segment breakdowns, materials lists, cost summaries, and customizable disclaimers — ready to hand to clients.
OptiSurface Land Forming Integration
Design tile drainage for the final surface, not the current one. Export your LiDAR to OptiSurface AGS format, design land forming there, then import the optimized surface back into Drain Pro. Your tile layout will account for planned grades and earthwork—so the system functions correctly after land forming is complete. Install dirt first, tile second, with confidence the depths and slopes match the real terrain.

DXF, KML & Shapefile Export
Export to DXF for AGPS DirtPro and PipeFM, KML for Google Earth and Ditch Assist, Shapefile for any GIS platform, or load files on a tablet for GPS-guided installation.

Full Project Backup & Restore
Save the entire project—boundaries, LiDAR, analysis layers, and designs—so you can revise, duplicate, or prove work anytime.
Simple, Predictable Pricing
Unlimited projects under one annual license, so you can scale your service without watching the meter.
Included Free: LiDAR Extractor
We know you won't use Geo-Surface for everything—so every Drain Pro member gets free access to our standalone LiDAR Extractor tool. Download survey-grade LiDAR data from US and Canadian government sources and export in 7 formats (GeoTIFF, Shapefile, CSV, KML, ASCII Grid, Surfer GRD, AGS) with flexible resolution and coordinate systems. Ready for QGIS, ArcGIS, OptiSurface, Google Earth, or any GIS application—access it from the main menu or your member area.
Ready to cut hours off your drainage design workflow?
Lock in intro pricing forever. Price will increase for new subscribers.
Tile Drainage Design Software for Contractors and Ag Professionals
Geo-Surface is a web-based drainage design platform that turns LiDAR elevation data into build-ready tile and surface drainage plans. No desktop GIS required.
- Tile drainage contractors quoting and designing systems all season
- Agricultural drainage consultants and agronomists
- Progressive farm operations managing drainage in-house
- Engineering and planning teams who need fast terrain and flow answers
Geo-Surface pulls LiDAR data across the US and Canada, runs flow and terrain analysis, and provides professional tools to design, grade, size, and export complete drainage systems — all in your browser. Stepped main sizing, best-fit grade optimization, DXF and KML export for machine guidance, and professional PDF reports are all included. Pro members also get free access to the standalone LiDAR Extractor — download survey-grade elevation data and export in 7 formats for any GIS, CAD, or precision ag application.
Need to see terrain? Use the Free Viewer.
Need to design drainage, quote jobs, and export build-ready files? You need Geo-Surface Drain Pro.
Need LiDAR data for other software? Every Pro member gets the LiDAR Extractor free.
Geo-Surface Drain Pro — Tile Drainage Design Software That Pays for Itself
Geo-Surface Drain Pro is where LiDAR becomes a business tool. Go from a field boundary to a fully graded, pipe-sized, export-ready drainage plan in minutes — not days.
It's built for drainage contractors and professionals who need accuracy, speed, and exportable data without fighting desktop GIS or paying five figures for legacy drainage software.
1. Setup & Terrain Analysis
Start every project with real elevation intelligence instead of eyeballing contours.
- Automatically fetch LiDAR across the US and Canada, or import your own survey DEMs
- Generate HD elevation overlays tuned for drainage — subtle grade changes stand out immediately
- Map high-definition flow paths to see exactly how water moves at field scale
- Identify depressions and ponding zones that drive yield loss
- Compute slope and wetness potential layers to target problem areas and plan tighter spacings
Result: in a couple of minutes you know where water comes from, where it wants to go, and where it gets stuck.
2. Intelligent Design Tools
The kind of control normally reserved for expensive engineering software — built specifically for drainage:
Draw Mains, Submains & Laterals
Interactive design directly on the LiDAR map with live profiles and instant feedback. Hover any line for stats, click to select and edit.
Stepped Main Sizing
Automatic step-down pipe sizes at every lateral connection based on cumulative contributing area. Each segment color-coded on the map for instant visual verification.
Best-Fit, Constant & Freeform Grade
Lock in slopes, starting depths, and outlet conditions with best-fit optimization. Freeform grade tools for manual control when you need it. Depth violation warnings and earthwork estimates built in.
Pattern Tile Layout
Generate systematic laterals with customizable spacing and automatic connections to mains. Adjustable grid overlay snaps to any existing line bearing for precise placement.
Surface Inlets
Place surface inlets on mains with flow-rate sizing. Inlet flow is automatically factored into downstream pipe calculations.
CAD-Style Annotations
Dimension lines, text labels, arrows, rectangles, filled areas, and exclusion zones — all on a toggleable layer, saved with the project.
Pipe Size Color Mode
View the entire design color-coded by pipe diameter. Dual-wall pipes display a block pattern. Customizable colors persist across sessions.
Win jobs at the kitchen table or the trade show. Pull LiDAR for a client's field on the spot, show them flow paths and a rough layout, and build confidence before anyone else has sent a quote.
3. Export & Machine Guidance
Clean outputs you can build from and send to clients — no extra software needed.
- DXF export for AGPS DirtPro, PipeFM, and AutoCAD — the formats your install crew actually uses
- KML export for Google Earth, Ditch Assist, and field navigation on a tablet
- Shapefile export for QGIS, ArcGIS, and any GIS platform
- Professional PDF reports with pipe schedules, stepped segment breakdowns, materials lists, cost summaries, and custom disclaimers
- GeoTIFF DEMs and analysis layers (elevation, depressions, slope, wetness) for use in other software
- AGS format for OptiSurface land forming integration — design tile on the planned surface, not the current one
- Full project backups to restore, revise, or hand off complete designs
OptiSurface Land Forming Integration
Export your LiDAR surface to OptiSurface AGS format, design land forming there, then import the optimized surface back into Drain Pro. Design tile drainage on the final planned surface — not the existing one. Install dirt first, tile second, with confidence the depths and slopes match.
Who Uses Geo-Surface Drain Pro
- Tile drainage contractors who need to quote fast, design accurately, and export files the install crew can use
- Agricultural consultants and agronomists offering drainage design and water management as a service
- Large farm operations managing drainage strategy in-house across multiple fields
- Engineering and planning teams who need terrain, flow, and wetness analysis without spinning up full GIS projects
- Conservation and watershed groups modeling runoff, outlet loading, and sensitive areas from real topography
If your work depends on proving "this is how the land drains" and delivering a plan someone can build from, Geo-Surface Drain Pro is built for you.
Geo-Surface Viewer — Free LiDAR Terrain for Everyone
Not ready to subscribe? The Viewer is free and open to all — explore LiDAR terrain data, review drainage designs, or share project files with clients.
- View LiDAR-based elevation and terrain colorization instantly — no account required
- Draw or import boundaries to visualize terrain for specific fields
- Open and review professional drainage designs created in Drain Pro
- Measure fields and capture map snapshots for planning or client discussions
No account. No paywall. No software installs. Great for landowners, municipal staff, or anyone who needs to check "does this field actually drain where I think it does?"
Coverage & Data Sources
Geo-Surface is designed to take advantage of modern elevation data infrastructure:
United States: Uses high-quality elevation data such as USGS 3DEP where available, enabling detailed drainage and terrain mapping for most agricultural regions.
Canada: Supports LiDAR and elevation coverage where provincial and federal datasets exist, with coverage expanding over time.
Custom Data: Already have your own RTK surveys or DEMs? Import supported GeoTIFFs to run the same analysis and design workflows on your own elevation data.
In every case, Geo-Surface helps you turn raw data into something usable: flow paths, depressions, slope masks, wetness potential, and buildable drainage layouts—without writing scripts or operating a GIS stack.
(Actual coverage and performance depend on availability and quality of source elevation data in your region.)
Why Browser-Based Drainage Design Software
Geo-Surface Drain Pro runs in a modern web browser — but it's not "lightweight" software. It's serious design capability without the friction that usually comes with desktop GIS.
- No installation — open your browser and start designing. Works on Windows, Mac, and tablets
- Design anywhere — at the office, at the kitchen table with a client, or at a trade show pulling live LiDAR
- Fast onboarding — consistent interface with built-in user manual, video tutorials, and documented workflows
- Always up to date — new features roll out automatically, no reinstalls or license upgrades
- Field-ready — open designs on a tablet, combine with GPS for on-site layout and verification
The tool that replaces the back-of-the-truck laptop running outdated desktop GIS.
LiDAR Extractor – Survey-Grade Data for Any Software, Free for Members
We know you won't use Geo-Surface for everything. That's why every Drain Pro subscriber gets free access to our standalone LiDAR Extractor tool—purpose-built to get high-quality elevation data into whatever software you're already using.
What LiDAR Extractor does:
- Downloads LiDAR data from USGS 3DEP (USA) and NRCan HRDEM (Canada) through one simple interface
- Exports in 7 formats: GeoTIFF, Shapefile, CSV, KML, ASCII Grid, Surfer GRD, and AGS (OptiSurface)
- Supports resolutions from 1m to 500m with intelligent resampling for point formats
- Handles coordinate systems automatically—UTM, Web Mercator, or WGS84 in meters or feet
- 3D preview before download so you can verify coverage and quality before exporting
What used to take hours of GIS work—searching government portals, deciphering metadata, converting formats—now takes minutes. No GIS expertise required.
LiDAR Extractor is ideal for feeding elevation data into QGIS, ArcGIS, OptiSurface, Google Earth, AutoCAD, or any application that needs georeferenced terrain data. Access it from the main menu or your member area after enrolling in Drain Pro.
Simple Pricing for Active Professionals
One subscription. Unlimited projects. No per-field fees or hidden export charges.
- Simple annual subscription per region (e.g., US or Canada)
- Unlimited projects within your licensed region under one Pro account
- No per-project unlock fees, no hidden export charges
- Free LiDAR Extractor tool included with every subscription—download and export LiDAR data in 7 formats
- Free Viewer remains available for anyone who just needs basic terrain visualization
Important Notes & Responsible Use
Geo-Surface provides powerful LiDAR-based analysis and design tools, but it does not replace:
- Local engineering requirements where they apply
- Detailed field survey where higher precision is needed
- Professional judgment on soils, legal outlets, permitting, or construction practices
Use Geo-Surface to design smarter and faster, then verify critical designs with appropriate site checks, survey control, and regulatory compliance.